Data on the CT Cultural Sector
CT Humanities gathers data on the CT cultural sector to help us, our grantees, and the legislature better understand who makes up the CT cultural sector and the impact the CT Cultural Fund Operating Support Grants have had on our state.
Jump to:
Data from the 2024 CT Nonprofit Cultural Sector Snapshot
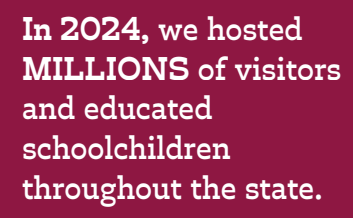
Who is the CT cultural sector and what is its impact?
Click the image to explore this data:
(Data from the 2024 CT Nonprofit Cultural Snapshot)
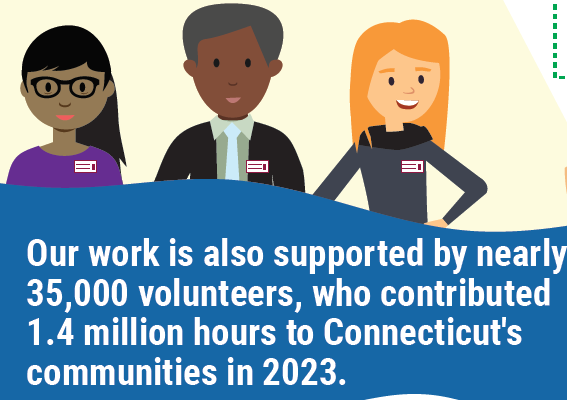
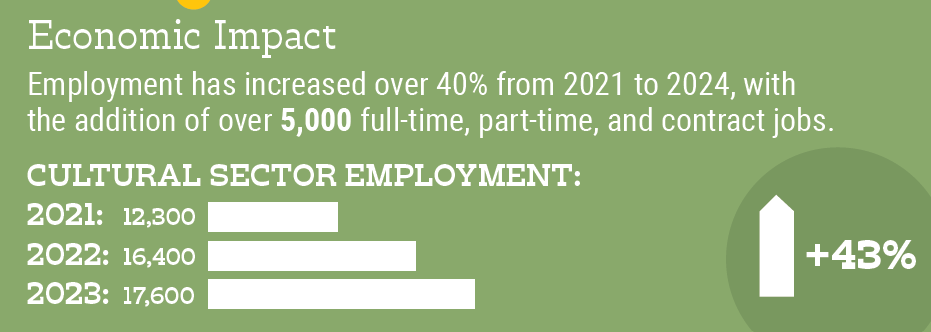
How has investment in the cultural sector had an economic, social, and educational impact on our state?
Click the image to explore this data:
(Data from the 2024 CT Nonprofit Cultural Snapshot)
What challenges does the cultural sector continue to face?
Click the image to explore this data:
Data from the 2023 Nonprofit CT Cultural Census
Who is the CT cultural sector and who do we serve?
Click the image to explore this data:
(Data from the 2023 Nonprofit CT Cultural Census)
How has investment in the cultural sector had an economic, social, and educational impact on our state?
Click the image to explore this data:
(Data from the 2023 Nonprofit CT Cultural Census)
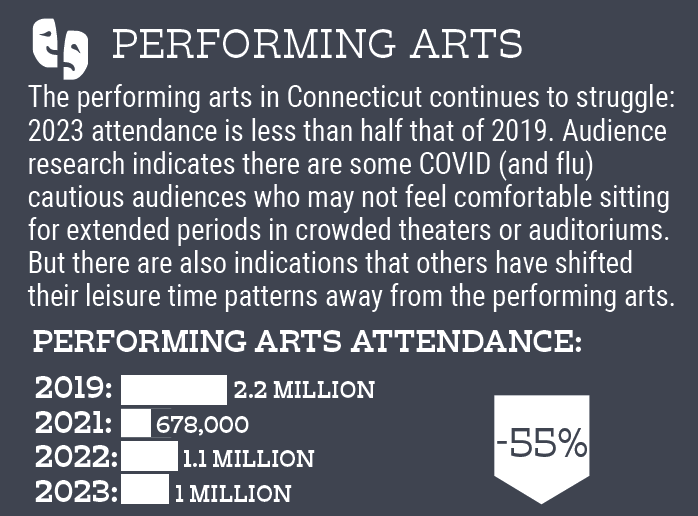
What challenges does the cultural sector continue to face?
Click the image to explore this data:
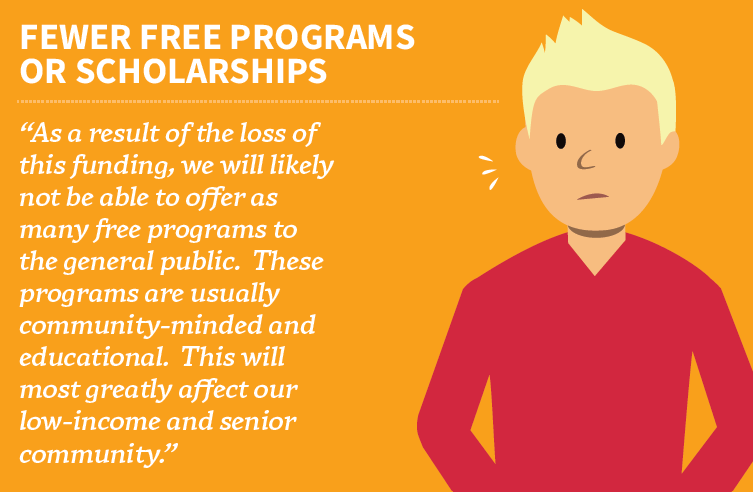
How is the elimination of the CT Cultural Fund expected to impact the cultural sector?
Click the image to explore this data:
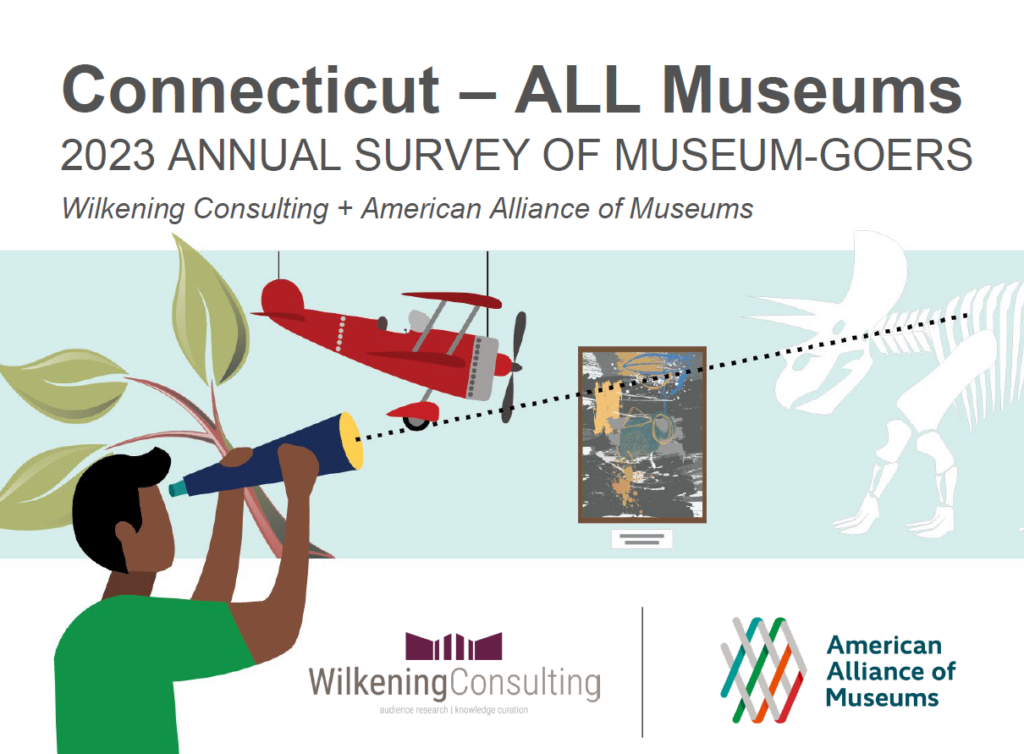
How do Connecticut’s museum-goers compare to national trends?
Click the image to explore this data:
(Data from Spring 2022)
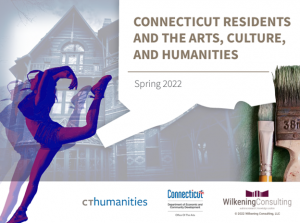
How does the general population of CT engage with the CT cultural sector?
Click the image to explore 2022 Broader Population Survey Results:
Data from the 2022 Nonprofit CT Cultural Census
Who is the CT cultural sector and who do we serve?
Click the image to explore this data, which is also broken down by county:
(Data from the 2022 Nonprofit CT Cultural Census)
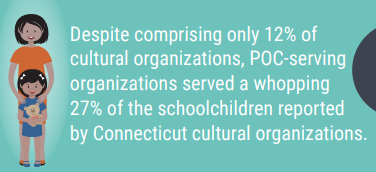
What do our state’s diverse cultural institutions look like, who do they serve, and what challenges do they face?
Click the image to view this data story:
(Data from the 2022 Nonprofit CT Cultural Census)
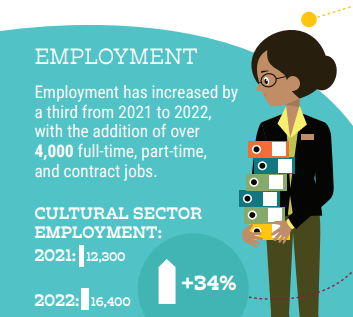
How has investment in the cultural sector impacted employment, visitation, and more?
Click the image to explore this data:
(Data from the 2022 Nonprofit CT Cultural Census)
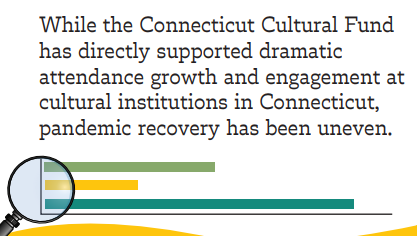
What challenges does the cultural sector continue to face?
Click the image to explore this data:
Data from the 2021 Nonprofit CT Cultural Census
Who is the CT cultural sector and who do we serve?
Click the image to explore this data, which is also broken down by county:
(Data from the 2021 Nonprofit CT Cultural Census)
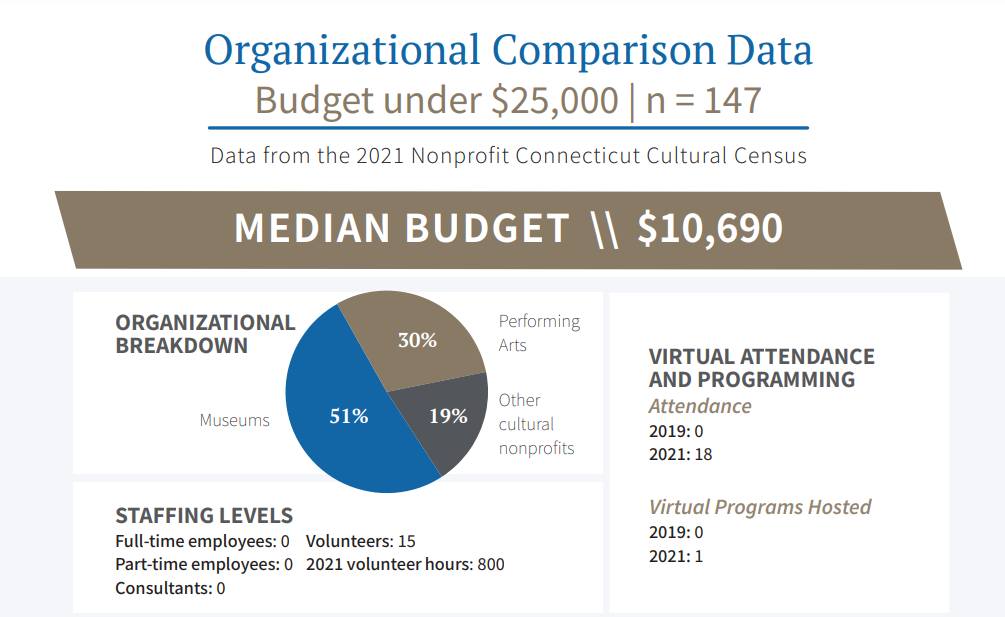
How does your organization compare to other similar organizations?
Click the image to explore organizational comparison data:
(Data from the 2021 Nonprofit CT Cultural Census)
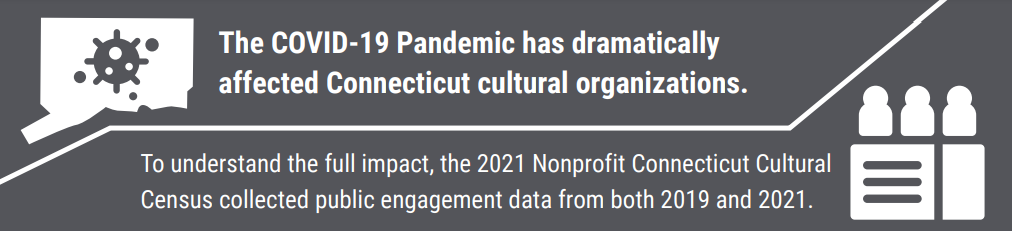
How did the COVID-19 pandemic impact the CT cultural sector between 2019 and 2021?
Click the image to explore this data: